Introduction
Evaluation is the process of assessing offers and submitted proposals in accordance with established evaluation methodology and criteria, with the goal of obtaining the best value for money. The process needs to be conducted in a fair and transparent manner to ensure equal treatment of all bidders.
The evaluation methodology and evaluation criteria shall be part of the solicitation documents. No further changes to such criteria communicated to the bidders can be changed after bids have been received [1].
Before moving into the evaluation directly we should have to have an understanding about certain concepts used for the evaluation as well.
This will describe the important concepts in evaluation, the scenario that we use to get an understanding about the evaluation process, how to prepare a financial evaluation analysis based on RAS factor and without it as well, and finally our recommendation on the best vendor who suits for the project.
We have been invited to join a team to evaluate the purchase of Storage for a project.
The Technical Sub Committee has short listed three Vendors whose storage as technically suitable for the project.
- Project evaluation horizon à 5 years
- NPV / DCF calculations à 7%
- Value of work done by the Project à 1M $ per Year
Vendors | Purchase Price ($) | Warranty | Storage Uptime (RAS) |
Period (Years) | Extension (Per Year ,$) | Other Details |
|
A | 1000K | 4 | 30 K | - On Site (Client Premises)
- Includes Parts/Labour/Transport
| 0.95 |
B | 900K | 3 | 20K | - Off Site (Vendor Premises)
- Includes Part/Labour
- Transport: 1 K$ Per Warranty Repair
| 0.94 |
C | 1100K | 5 |
| - On Site (Client Premises)
- Includes Part/Labour/Transport
| 0.96 |
* Vendor Storage Uptime is based on RAS (Reliability, Availability & Serviceability)
We have to research on DCF (Discounted Cash Flow), NPV (Net Present value and TCO (Total Cost of Ownership) as a foundation for handling the above scenario. We have been advised to use Net Present Value (NPV) methodology to determine the Total Cost Ownership (TCO) to make our recommendations in a report to management. We also have to include our comments based on RAS considerations and any further recommendations that can be included in the report.
In finance, the net present value (NPV) or net present worth (NPW) of a time series of cash flows, both incoming and outgoing, is defined as the sum of the present values (PVs) of the individual cash flows. In the case when all future cash flows are incoming (such as coupons and principal of a bond) and the only outflow of cash is the purchase price, the NPV is simply the PV of future cash flows minus the purchase price (which is its own PV) [1]
In other words, NPV is the amount of money an investment is worth in today's dollars, taking into account the amount of the investment, the length of the investment, how long it takes the investment to return a profit and the cost of money (interest and risk). Put another way, NPV is the current amount of money you would pay for a future investment (always some fraction smaller than one). [2]
If the NPV of a prospective project is positive, it should be accepted. However, if NPV is negative, the project should probably be rejected because cash flows will also be negative.
For example, if a retail clothing business wants to purchase an existing store, it would first estimate the future cash flows that store would generate, and then discount those cash flows into one lump-sum present value amount, say $565,000. If the owner of the store was willing to sell his business for less than $565,000, the purchasing company would likely accept the offer as it presents a positive NPV investment. Conversely, if the owner would not sell for less than $565,000, the purchaser would not buy the store, as the investment would present a negative NPV at that time and would, therefore, reduce the overall value of the clothing company. [3]
Each cash inflow or outflow is discounted back to its present value (PV). Then they are summed. Therefore NPV is the sum of all terms,
Where,
§ t - the time of the cash flow
§ i - the discount rate (the rate of return that could be earned on an investment in the financial markets with similar risk.)
§ Rt - the net cash flow (the amount of cash, inflow minus outflow) at time t. For educational purposes, R0 is commonly placed to the left of the sum to emphasize its role as (minus) the investment.
The result of this formula if multiplied with the Annual Net cash in-flows and reduced by Initial Cash outlay will be the present value but in case where the cash flows are not equal in amount then the previous formula will be used to determine the present value of each cash flow separately. Any cash flow within 12 months will not be discounted for NPV purpose. [4]
NPV is a way to decide whether or not to invest in a project by looking at the projected cash inflows and outflows. Really the NPV is an indicator of how much value an investment or project adds to the firm.
If | Description | Decision |
NPV > 0 | The investment would add value to the firm | The project may be accepted |
NPV < 0 | The investment would subtract value from the firm | The project should be rejected |
NPV = 0 | The investment would neither gain nor lose value for the firm | We should be indifferent in the decision whether to accept or reject the project. This project adds no monetary value. Decision should be based on other criteria, e.g. strategic positioning or other factors not explicitly included in the calculation. |
A valuation method used to estimate the attractiveness of an investment opportunity. Discounted cash flow (DCF) analysis uses future free cash flow projections and discounts them (most often using the weighted average cost of capital) to arrive at a present value, which is used to evaluate the potential for investment. If the value arrived at through DCF analysis is higher than the current cost of the investment, the opportunity may be a good one [5].
A discounted cash flow (DCF) is the most fundamentally correct way of valuing an investment. Most other methods of valuation, such as valuation ratios, can, to a large extent, be seen as simplified approximations of a DCF. The many estimates and assumptions required by a DCF introduce a lot of uncertainty, often making it no better than simpler models.
The value of an asset is the value of the future benefits it brings. The value of an investment is that cash flows that it will generate for the investor: interest payments, dividends, repayments, returns of capital, etc.
These cash flows need to be adjusted for two things:
- The time value of money
- The risk that the amount of money will not be what is expected.
In a DCF valuation, a discount rate is chosen which reflects the risk (the higher the risk the higher the discount rate) and this is used to discount all forecast future cash flows to calculate a present value:
Calculated as:
The formula above can be adjusted for periods other than a year in the same way as the NPV formula. The formulae differ because this excludes the time zero cash flow: e.g. the cost of buying a security.
In the case of bonds, the cash flows would be interest payments and repayments. Shares are more complex and give us a choice of methods. Hybrid securities may be bond like (and therefore can be valued using a DCF), or contain embedded options that need more complex valuation.
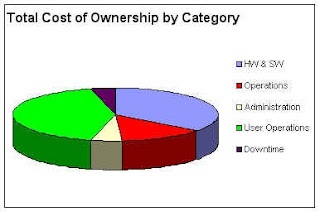
Total Cost of Ownership analysis or Cost of Ownership, is a business case designed especially to find the lifetime costs of acquiring, operating, and changing something. TCO analysis often shows there can be a large difference between the price of something and its long term cost.
Further more this can be also described as the total cost of a computer asset throughout its lifecycle, from acquisition to disposal. The aim of TCO analysis is to identify, quantify, and ultimately, reduce the overall costs associated with ownership of networked assets.
Total Cost of Ownership is the combined hard and soft costs of owning networked information assets. 'Hard' costs include items such as the purchase price of the asset, implementation fees, upgrades, maintenance contracts, support contracts, and disposal costs. These costs are considered 'hard costs' because they are tangible and easily accounted for. Even more significant in most environments however, are the 'soft' costs related to management, support, training, hidden costs, and downtime. Because they don't occur at acquisition time, they are often overlooked in budgets, often leading to unexpected increases or worse, a transfer of management and support responsibility to end users. [6]
Those who purchase or manage computing systems have had a high interest in TCO since the 1980s, when the potentially large difference between IT cost and IT purchase price started drawing the attention of IT vendor marketing (largely from competitors of IBM). The five year cost of ownership for major computing systems can be five to eight times the hardware and software acquisition costs.
Today, TCO analysis is used to support acquisition and planning decisions for a wide range of assets that bring significant maintenance or operating costs across a long usable life. Total cost of ownership is used to support decisions involving computing systems, vehicles, buildings, laboratory equipment, medical equipment, factory machines, and private aircraft, for instance. Today, TCO analysis for these kinds of assets is a central concern in,
- Budgeting and planning
- Asset life cycle management
- Prioritizing capital acquisition proposals
- Vendor selection
- Lease vs. buy decisions [7]
Reliability, Availability and Serviceability (RAS) is a set of related attributes that must be considered when designing, manufacturing, purchasing or using a computer product or component. The term was first used by IBM to define specifications for their mainframe s and originally applied only to hardware. Today RAS is relevant to software as well and can be applied to network s, application program s, operating systems (OS s), personal computers ( PC s), server s and supercomputer s.
The term reliability refers to the ability of a computer-related hardware or software component to consistently perform according to its specifications. In theory, a reliable product is totally free of technical errors. In practice, vendors commonly express product reliability as a percentage. The Institute of Electrical and Electronics Engineers ( IEEE ) sponsors an organization devoted to reliability in engineering known as the IEEE Reliability Society (IEEE RS).
Availability is the ratio of time a system or component is functional to the total time it is required or expected to function. This can be expressed as a direct proportion (for example, 9/10 or 0.9) or as a percentage (for example, 90%). It can also be expressed in terms of average downtime per week, month or year or as total downtime for a given week, month or year. Sometimes availability is expressed in qualitative terms, indicating the extent to which a system can continue to work when a significant component or set of components goes down.
Serviceability is an expression of the ease with which a component, device or system can be maintained and repaired. Early detection of potential problems is critical in this respect. Some systems have the ability to correct problems automatically before serious trouble occurs; examples include built-in features of OSs such as Microsoft Windows XP and auto-protect-enabled anti-virus software and spyware detection and removal programs. Ideally, maintenance and repair operations should cause as little downtime or disruption as possible.
Some of the key elements of RAS are:
- Over-engineering, which is designing systems to specifications better than minimum requirements.
- Duplication, which is extensive use of redundant systems and components.
- Recoverability, which is the use of fault-tolerant engineering methods.
- Automatic updating, which is keeps OSs and applications current without user intervention.
- Data backup, which prevents catastrophic loss of critical information.
- Data archiving, which keeps extensive records of data in case of audits or other recovery needs?
- Power-on replacement, which is the ability to hot swap components or peripherals.
- The use of virtual machine s, which minimizes the impact of OS or software faults.
- Use of surge suppressor s, which minimizes risk of component damage resulting from power-line anomalies.
- Continuous power, which is the use of an uninterruptible power supply, keeps systems operational while switching from commercial power to backup or auxiliary power.
- Backup power sources, which includes batteries and generators to keep systems operational during extended interruptions in commercial power. [8]
Evaluation is the process of assessing offers and submitted proposals in accordance with established evaluation methodology and criteria, with the goal of obtaining the best value for money. The process needs to be conducted in a fair and transparent manner to ensure equal treatment of all bidders. [10]
The below areas are used in evaluating the above scenario.
- Administrative Analysis
- Technical Analysis
- Financial Analysis
Usually submitted offers will be reviewed to determine compliance with any formal criteria included in the solicitation documents. Examples of formal requirements may include, but are not limited to, the following:
- Offers must be submitted within the stipulated deadline
- Offers must include required securities
- Offers must meet required Offer Validity
- Offers have been signed by the proper authority
- Offers include requested company documentation, including documentation regarding the company’s legal status and registration
- Offers must comply with general administrative requirements [10]
For the given scenario,
Only the three vendors, Vendor A, Vendor B, and Vendor C are compliant with the formal criteria included in the solicitation documents.
The first step is to ensure the eligibility of bidders and that suppliers are qualified.
Technical criteria will cover two general areas:
· Criteria related to a company’s capacities and capabilities
· Criteria related to the goods, services and works to be delivered
The evaluation criteria are derived from the specifications. Depending on the nature and the complexity of the procurement activities, technical evaluation criteria may be few or many.
The technical evaluation criteria should guide the evaluation team to the right company profile (capable of doing the job); moreover they shall include the right specifications to meet a project’s needs.
Depending on the selected approach, technical criteria shall be evaluated based on a compliance/non-compliance (pass/fail) or weighted scoring system.
Examples of technical criteria include:
· Previous experience in similar projects;
· Experience in a particular region or the country;
· Manufacturing capacity (goods) and competences and capabilities (for services and works);
· Ability to provide after-sales services and/or technical support;
· Delivery time within certain parameters, in particular in cases of emergency; procurement where delivery (for goods) or completion period (for services and works) is critical;
· Certification of compliance to national and international quality standards (e.g., ISO);
· Responsiveness of bids/offers to specifications. [10]
For the given scenario,
The three vendors, Vendor A, Vendor B, and Vendor C has previous experience in similar projects. All three have good capabilities for services and providing technical support.
Price is an important factor in the evaluation process. However, the weight that price carries in the selection of a supplier will depends.
For the given scenario,
We have done the financial analysis based on two ways,
· Without considering the RSA factors
· Considering the RSA factors
Detail explanation on the financial analysis is provided in below sections.
Vendor A
| YEARS |
|
| 0 | 1 | 2 | 3 | 4 | 5 |
|
INVESTMENT | -1,000,000 |
|
|
|
|
| -1,000,000 |
INCOME | - | 1,000,000 | 1,000,000 | 1,000,000 | 1,000,000 | 1,000,000 | 5,000,000 |
EXPENDITURES | - | 0 | 0 | 0 | 0 | -30,000 | -30,000 |
|
|
|
|
|
|
|
|
NET CASH FLOW | -1,000,000 | 1,000,000 | 1,000,000 | 1,000,000 | 1,000,000 | 970,000 | 3,970,000 |
|
|
|
|
|
|
|
|
DISCOUNT RATE | 0.07 | 0.07 | 0.07 | 0.07 | 0.07 | 0.07 |
|
|
|
|
|
|
|
|
|
DISCOUNTED CASH FLOW | 1 | 0.935 | 0.873 | 0.816 | 0.763 | 0.713 |
|
|
|
|
|
|
|
|
|
PERCENT VALUE (PV) | -1,000,000.00 | 934,579.44 | 873,438.73 | 816,297.88 | 762,895.21 | 691,596.59 | 3,078,807.85 |
|
|
|
|
|
|
|
|
NET PERCENT VALUE (NPV) |
|
|
|
|
|
| 3,078,807.85 |
Vendor B
| YEARS |
|
| 0 | 1 | 2 | 3 | 4 | 5 |
|
INVESTMENT | -900,000 |
|
|
|
|
| -900,000 |
INCOME | - | 1,000,000 | 1,000,000 | 1,000,000 | 1,000,000 | 1,000,000 | 5,000,000 |
EXPENDITURES | - | -1,000 | -1,000 | -1,000 | -20,000 | -20,000 | -43,000 |
|
|
|
|
|
|
|
|
NET CASH FLOW | -900,000 | 999,000 | 999,000 | 999,000 | 980,000 | 980,000 | 4,057,000 |
|
|
|
|
|
|
|
|
DISCOUNT RATE | 0.07 | 0.07 | 0.07 | 0.07 | 0.07 | 0.07 |
|
|
|
|
|
|
|
|
|
DISCOUNTED CASH FLOW | 1 | 0.935 | 0.873 | 0.816 | 0.763 | 0.713 |
|
|
|
|
|
|
|
|
|
PERCENT VALUE (PV) | -900,000.00 | 933,644.86 | 872,565.29 | 815,481.58 | 747,637.31 | 698,726.46 | 3,168,055.49 |
|
|
|
|
|
|
|
|
NET PERCENT VALUE (NPV) |
|
|
|
|
|
| 3,168,055.49 |
Vendor C
| YEARS |
|
| 0 | 1 | 2 | 3 | 4 | 5 |
|
INVESTMENT | -1,100,000 |
|
|
|
|
| -1,100,000 |
INCOME | - | 1,000,000 | 1,000,000 | 1,000,000 | 1,000,000 | 1,000,000 | 5,000,000 |
EXPENDITURES | - | 0 | 0 | 0 | 0 | 0 | 0 |
|
|
|
|
|
|
|
|
NET CASH FLOW | -1,100,000 | 1,000,000 | 1,000,000 | 1,000,000 | 1,000,000 | 1,000,000 | 3,900,000 |
|
|
|
|
|
|
|
|
DISCOUNT RATE | 0.07 | 0.07 | 0.07 | 0.07 | 0.07 | 0.07 |
|
|
|
|
|
|
|
|
|
DISCOUNTED CASH FLOW | 1 | 0.935 | 0.873 | 0.816 | 0.763 | 0.713 |
|
|
|
|
|
|
|
|
|
PERCENT VALUE (PV) | -1,100,000.00 | 934,579.44 | 873,438.73 | 816,297.88 | 762,895.21 | 712,986.18 | 3,000,197.44 |
|
|
|
|
|
|
|
|
NET PERCENT VALUE (NPV) |
|
|
|
|
|
| 3,000,197.44 |
According to the above financial analysis, we can provide the summary as below.
Factors Considered | Vendors |
Vendor A | Vendor B | Vendor C |
Purchase Price | 1000 K | 900 K | 1100 K |
Expenses (Deducted) | * Warranty Period - 4 years
* Onsite
* Includes Parts, Labour & Transport
* Warranty Extension 30K$/Year | * Warranty Period - 3 years
* Offsite
* Includes Parts, Labour & Transport
* Transport: 1K$ per Warranty Repair; expected 1 repair per year
* Warranty Extension 20K$/Year | * Warranty Period - 5 years
* Onsite
* Includes Parts, Labour & Transport |
NPV | 3,078,807.85 | 3,168,055.49 | 3,000,197.44 |
After considering the above summary of the financial analysis which has been done without considering the RSA factors, we can say that we will go for Vendor B since it has the high NPV value with a low purchase price and less number of expenses.
After doing further research on those vendors Storage products, we found that the following storage uptime data.
- Vendor A à 0.95
- Vendor B à 0.94
- Vendor C à 0.96
The below financial analysis is done by considering the RAS factors.
Vendor A
| YEARS |
|
| 0 | 1 | 2 | 3 | 4 | 5 |
|
INVESTMENT | -1,000,000 |
|
|
|
|
| -1,000,000 |
INCOME | - | 1,000,000 | 1,000,000 | 1,000,000 | 1,000,000 | 1,000,000 | 5,000,000 |
|
|
|
|
|
|
|
|
RAS FACTOR |
| 0.95 | 0.95 | 0.95 | 0.95 | 0.95 |
|
RAS FACTOR VALUE FOR 0.95 |
| 950,000 | 950,000 | 950,000 | 950,000 | 950,000 |
|
|
|
|
|
|
|
|
|
EXPENDITURES | - | -50,000 | -50,000 | -50,000 | -50,000 | -80,000 | -280,000 |
|
|
|
|
|
|
|
|
NET CASH FLOW | -1,000,000 | 950,000 | 950,000 | 950,000 | 950,000 | 920,000 | 3,720,000 |
|
|
|
|
|
|
|
|
DISCOUNT RATE | 0.07 | 0.07 | 0.07 | 0.07 | 0.07 | 0.07 |
|
|
|
|
|
|
|
|
|
DISCOUNTED CASH FLOW | 1 | 0.935 | 0.873 | 0.816 | 0.763 | 0.713 |
|
|
|
|
|
|
|
|
|
PERCENT VALUE (PV) | -1,000,000.00 | 887,850.47 | 829,766.79 | 775,482.98 | 724,750.45 | 655,947.29 | 2,873,797.98 |
|
|
|
|
|
|
|
|
NET PERCENT VALUE (NPV) |
|
|
|
|
|
| 2,873,797.98 |
Vendor B
| YEARS |
|
| 0 | 1 | 2 | 3 | 4 | 5 |
|
INVESTMENT | -900,000 |
|
|
|
|
| -900,000 |
INCOME | - | 1,000,000 | 1,000,000 | 1,000,000 | 1,000,000 | 1,000,000 | 5,000,000 |
|
|
|
|
|
|
|
|
RAS FACTOR |
| 0.94 | 0.94 | 0.94 | 0.94 | 0.94 |
|
RAS FACTOR VALUE FOR 0.94 |
| 940,000 | 940,000 | 940,000 | 940,000 | 940,000 |
|
|
|
|
|
|
|
|
|
EXPENDITURES | - | -61,000 | -61,000 | -61,000 | -80,000 | -80,000 | -343,000 |
|
|
|
|
|
|
|
|
NET CASH FLOW | -900,000 | 939,000 | 939,000 | 939,000 | 920,000 | 920,000 | 3,757,000 |
|
|
|
|
|
|
|
|
DISCOUNT RATE | 0.07 | 0.07 | 0.07 | 0.07 | 0.07 | 0.07 |
|
|
|
|
|
|
|
|
|
DISCOUNTED CASH FLOW | 1 | 0.935 | 0.873 | 0.816 | 0.763 | 0.713 |
|
|
|
|
|
|
|
|
|
PERCENT VALUE (PV) | -900,000.00 | 877,570.09 | 820,158.97 | 766,503.71 | 701,863.60 | 655,947.29 | 2,922,043.65 |
|
|
|
|
|
|
|
|
NET PERCENT VALUE (NPV) |
|
|
|
|
|
| 2,922,043.65 |
Vendor C
| YEARS |
|
| 0 | 1 | 2 | 3 | 4 | 5 |
|
INVESTMENT | -1,100,000 |
|
|
|
|
| -1,100,000 |
INCOME | - | 1,000,000 | 1,000,000 | 1,000,000 | 1,000,000 | 1,000,000 | 5,000,000 |
|
|
|
|
|
|
|
|
RAS FACTOR |
| 0.96 | 0.96 | 0.96 | 0.96 | 0.96 |
|
RAS FACTOR VALUE FOR 0.96 |
| 960,000 | 960,000 | 960,000 | 960,000 | 960,000 |
|
|
|
|
|
|
|
|
|
EXPENDITURES | - | -40,000 | -40,000 | -40,000 | -40,000 | -40,000 | -200,000 |
|
|
|
|
|
|
|
|
NET CASH FLOW | -1,100,000 | 960,000 | 960,000 | 960,000 | 960,000 | 960,000 | 3,700,000 |
|
|
|
|
|
|
|
|
DISCOUNT RATE | 0.07 | 0.07 | 0.07 | 0.07 | 0.07 | 0.07 |
|
|
|
|
|
|
|
|
|
DISCOUNTED CASH FLOW | 1 | 0.935 | 0.873 | 0.816 | 0.763 | 0.713 |
|
|
|
|
|
|
|
|
|
PERCENT VALUE (PV) | -1,100,000.00 | 897,196.26 | 838,501.18 | 783,645.96 | 732,379.40 | 684,466.73 | 2,836,189.54 |
|
|
|
|
|
|
|
|
NET PERCENT VALUE (NPV) |
|
|
|
|
|
| 2,836,189.54 |
According to the above financial analysis, we can provide the summary as below.
Factors Considered | Vendors |
Vendor A | Vendor B | Vendor C |
Purchase Price | 1000 K | 900 K | 1100 K |
Expenses (Deducted) | * Warranty Period - 4 years
* Onsite
* Includes Parts, Labour & Transport
* Warranty Extension 30K$/Year | * Warranty Period - 3 years
* Offsite
* Includes Parts, Labour & Transport
* Transport: 1K$ per Warranty Repair; expected 1 repair per year
* Warranty Extension 20K$/Year | * Warranty Period - 5 years
* Onsite
* Includes Parts, Labour & Transport |
RAS Factor | 0.95 | 0.94 | 0.96 |
NPV | 2,873,797.98 | 2,922,043.65 | 2,836,189.54 |
After considering the above summary of the financial analysis which has been done by considering the RSA factors, we can say that we will go for Vendor B since it has the high NPV value with the lowest purchase price.
According to the financial analyses completed, we identified the below effects.
When the analysis was done, without considering the RAS factors,
- Vendor B has the highest NPV of 3,168,055.49 $
- He could make the high NPV since he owned the lowest purchased price in comparing with others.
As per the above justifications, we selected Vendor B as the best vendor among all the others without considering the RAS factors.
RAS was a very important factor used for these kinds of decision making process.
So once the analysis was done, in considering the RAS factors there were several aspects that we had to thoroughly walk through.
- As we discussed earlier, since it’s the same scenario that we used, since the Vendor B has the lowest purchased price, they owned the highest NPV of 2,922,043.65.
- If we assume the system does not handle much critical data, then selecting vendor B will give us high NPV for a fairly sustainable system.
- Vendor C has the highest storage uptime level
- But he has the lowest NPV value as well.
- If our system handles much critical data, then we think it’s the best thing to select vendor C since he has the highest RAS of 0.96.
Since the RAS is the most important thing that affects the evaluation, we would go for Vendor C since it has the highest RAS factor.
In conclusion of the above document you can see how to do a financial analysis with the use of the RAS and without it.
This entire post will help you to,
- Identify the concepts related in performing a financial analysis
- Learn how to do the calculations on NPV based on a given scenario
- Analyze the requirements and perform a successful financial evaluation.
[1] “Net Present Value”. [Online]. Available: http://en.wikipedia.org/wiki/Net_present_value [Accessed: March 16, 2011].
[2] “Net Present Value”. [Online]. Available: http://nationalhogfarmer.com/genetics-reproduction/evaluation-selection/0109-npv-anaylsis-process/ [Accessed: March 16, 2011].
[3] “Net Present Value”. [Online]. Available: http://www.investopedia.com/terms/n/npv.asp [Accessed: March 16, 2011].
[4] “Net Present Value Calculation”. [Online]. Available: http://www.ehow.com/how_2187130_calculate-net-present-value-npv.html [Accessed: March 16, 2011].
[5] “DCF”. [Online]. Available: http://www.investopedia.com/terms/d/dcf.asp [Accessed: March 16, 2011].
[6] “TCO”. [Online]. Available: http://www.solutionmatrix.com/total-cost-of-ownership.html [Accessed: March 16, 2011].
[7] “TCO”. [Online]. Available: http://www.micromationinc.com/what-is-total-cost-of-ownership.htm [Accessed: March 16, 2011].
[8] “RAS”. [Online]. Available: http://whatis.techtarget.com/definition/0,,sid9_gci1232701,00.html [Accessed: March 16, 2011].
[9] “RAS”. [Online]. Available: http://www.google.com/finance?client=ob&q=NYSE:RAS [Accessed: March 16, 2011].
[10] “Evaluation and Comparison of Offers”. [Online]. Available: http://content.undp.org/go/userguide/cap/evalutn-ofers/eval-compare-offers/?lang=en [Accessed: March 16, 2011].

 But finally, I followed the below steps,


